Gold price analysis is a scientific tool for predicting market trends and making informed investment decisions. The price of 18-karat gold in Iran, influenced by key factors such as exchange rates, inflation, and global developments, is constantly fluctuating. This page examines technical and fundamental analyses, identifies key buying and selling points, and presents probable future scenarios.

What is Gold Price Analysis and Why is it Important?
Gold price analysis is the process of meticulously examining price data and related economic factors to forecast future market movements. This approach helps investors determine the optimal time to buy or sell their assets. In Iran’s market, gold prices are heavily dependent on the dollar exchange rate and inflation, making precise analysis essential for risk reduction and profit maximization. The Homoro platform and our Telegram channels provide daily analyses to support better decision-making.
The Role of Analysis in Gold Investment
Gold price analysis enables investors to identify critical market points. For example, if the price of 18-karat gold reaches the support level of 6.4 million Tomans—a level that has held multiple times in recent months—buying at this point could be profitable, as prices typically rebound from this level. Essentially, gold price analysis minimizes the risk of losses from unexpected fluctuations.
Difference Between Technical and Fundamental Analysis
Technical analysis uses price charts and technical indicators for short-term predictions. For instance, the resistance level of 6.85 million Tomans for 18-karat gold indicates a price point where sellers typically enter the market, preventing further upward movement. Fundamental analysis examines economic factors such as the dollar exchange rate or global ounce prices. For example, the dollar’s rise to 86,000 Tomans in 2024 pushed gold prices to 6.8 million Tomans. Combining these methods enhances forecasting accuracy.
Technical Analysis of Gold Prices (Daily Updates)
Technical analysis predicts short-term market trends using price charts and technical indicators. For example, the resistance level of 6.85 million Tomans for 18-karat gold represents a point where selling pressure typically increases, halting further price growth. This section evaluates key levels and price patterns with up-to-date data. Homoro’s exclusive charts present these analyses visually and accessibly.
Key Buying and Selling Points
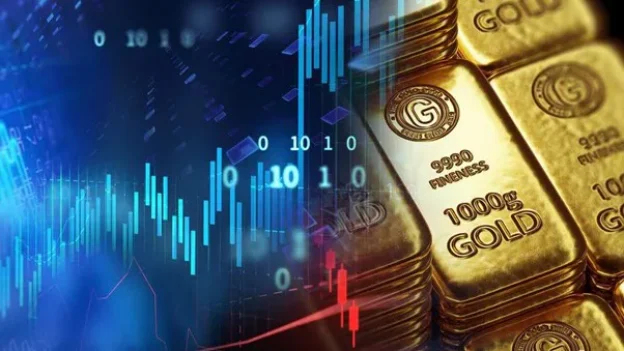
The price of 18-karat gold is currently fluctuating between 6.4 to 6.85 million Tomans. The support level of 6.4 million Tomans, which has been tested multiple times in the 4-hour timeframe, is considered an appropriate buying point as the price has stabilized at this level. On the other hand, the resistance level of 6.85 million Tomans is the main barrier to price growth. If this level is broken, gold prices could potentially rise to 7.2 million Tomans. Homoro’s Telegram channels and this page update these levels daily.
Chart and Uptrend Channel
18-karat gold prices have been moving in an upward channel since 2018. Between 2022-2024, the price hit the midline of 6.4 million Tomans before moving toward the channel’s upper limit at 7.5 million Tomans. Currently, the price has stabilized near the midline. Homoro’s candlestick charts show that short-term moving averages are intertwined, indicating a consolidation phase before the market’s next move.
Fundamental Analysis of Gold Prices in Iran
Fundamental gold price analysis examines economic, political and global factors affecting the market. In Iran, 18-karat gold prices are heavily influenced by exchange rates and global ounce prices. Fundamental gold price analysis enables investors to understand the roots of fluctuations and make more precise decisions.
Impact of Dollar Rates
The dollar exchange rate directly affects 18-karat gold prices. For example, in late 2024 when the dollar reached 86,000 Tomans, the price per gram of 18-karat gold rose to 6.8 million Tomans. This relationship exists due to the domestic market’s dependence on foreign currency. The devaluation of the Rial, caused by inflation and sanctions, increases demand for gold as a value preservation tool. For instance, a temporary drop in the dollar to 80,000 Tomans in May 2024 reduced gold prices to 6.5 million Tomans.
Impact of Global Ounce Prices
The global gold ounce price is another determining factor for domestic prices. In May 2024, the gold ounce reached $3,360 due to the weakening US dollar index and trade tensions. This global growth strengthened 18-karat gold prices even with relative stability of the dollar in Iran. Investors must carefully monitor global fluctuations to capitalize on opportunities.
Gold Price Forecasts and Future Scenarios
Gold price forecasts for 2024 depend on simultaneous analysis of technical, fundamental and geopolitical factors. This section examines probable scenarios with precise data so investors can adjust their strategies. Homoro’s training courses in collaboration with Shahid Beheshti University teach the necessary methods for these forecasts.
Bullish Scenario
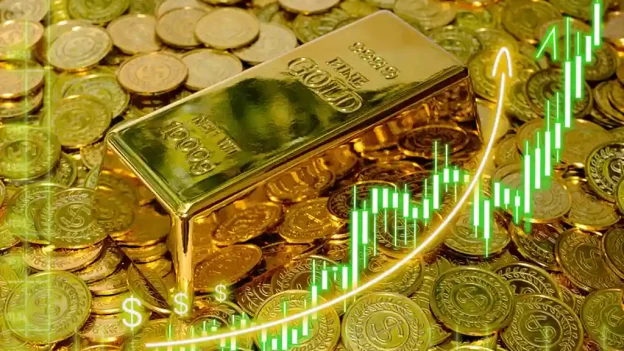
If 18-karat gold prices break the 6.85 million Tomans resistance level, an upward movement may begin. This scenario becomes probable if the dollar rises above 90,000 Tomans or the global ounce exceeds $3,700. In this case, prices could reach 7.2-7.4 million Tomans. For example, JP Morgan’s forecast of $3,657 per ounce by late 2024 supports this scenario.
Bearish Scenario
If the 6.4 million Tomans support level is broken, prices may drop to 6.0 million Tomans. This scenario could occur with strengthening of the global dollar or easing geopolitical tensions, such as nuclear deal agreements. For instance, dollar stability at 80,000 Tomans and the ounce dropping to $3,150 could accelerate this movement. Investors should monitor trading volumes to avoid losses from this decline.
Tools and Resources for Gold Analysis
Analytical tools and reliable resources enable investors to accurately monitor 18-karat gold prices. These tools provide updated data and price patterns to improve decision-making.
Charts and Indicators
Candlestick charts, as primary technical analysis tools, provide visual representations of price fluctuations in specific timeframes. Each candle contains key information including opening, closing, highest and lowest prices. Additionally, indicators like the Relative Strength Index (RSI) are useful tools that measure market momentum and help traders identify overbought or oversold conditions to avoid premature entries.
Daily Updates
Real-time data is crucial for traders to make logical decisions. Online platforms like Homoro update gold price fluctuation charts. Homoro’s channels also provide daily analyses for quick decision-making.
Why Is This Landing Page the Best for You?
This page provides a comprehensive resource for gold price analysis. Its precise and up-to-date information equips investors with confident decision-making capabilities.
Advantages of Daily Analysis
Daily analyses reduce trading risks. This page integrates technical and fundamental data to enhance investment strategies. Quick access to this information shortens reaction time to market fluctuations, enabling users to make better decisions in gold trading.
To master gold price analysis, follow this page and Homoro’s channels. Additionally, daily analyses and Shahid Beheshti University-supervised educational courses will prepare you for professional investing. Join Homoro’s Telegram channels today and bookmark this page for faster access to gold price analysis charts.

