
Latest Ethereum Price Analyses
Ethereum’s price has experienced significant fluctuations since its initial launch in 2015. Historical data shows ETH’s value grew from just a few dollars initially to several thousand dollars in recent years.
A key historical milestone was the network’s upgrade to Proof-of-Stake (PoS) protocol in 2022, which directly impacted Ethereum’s price appreciation. Other influential factors include technological advancements, adoption by major institutions (like Meta and Amazon), and regulatory changes across different countries.
At Homoro, we monitor these developments closely. Through our certified courses supervised by Shahid Beheshti University, we help you succeed in this dynamic market.
Ethereum Analysis – 4 Khordad
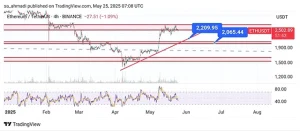
In the 4-hour timeframe, Ethereum is facing a crucial resistance level. Having failed twice to break through this resistance, there are signs of a potential double-top pattern forming.
If the $2,300 level breaks downward, the double-top pattern would be confirmed, potentially leading to a temporary corrective trend.
The first support level is the red trendline shown in the chart, with $2,200 acting as initial support.
If this level breaks, the next reliable support zones would be at $2,000, followed by $1,800. A breakdown below $1,800 would shift Ethereum’s trend from bullish to bearish, potentially leading to a medium-term correction.
However, if Ethereum breaks the current resistance with strong bullish candles, reaching new all-time highs remains possible.
Note: This analysis represents Homoro team’s perspective only.
Ethereum (ETH) Analysis - May 9
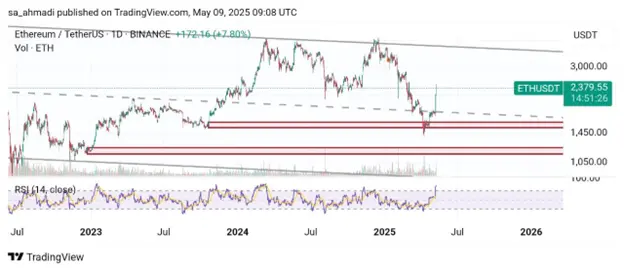
Ethereum has shown strong bullish momentum with consecutive green candles. If Bitcoin breaks its resistance level (mentioned in our previous post), ETH could rally to the upper channel limit!
This is analysis only, not a buy signal.
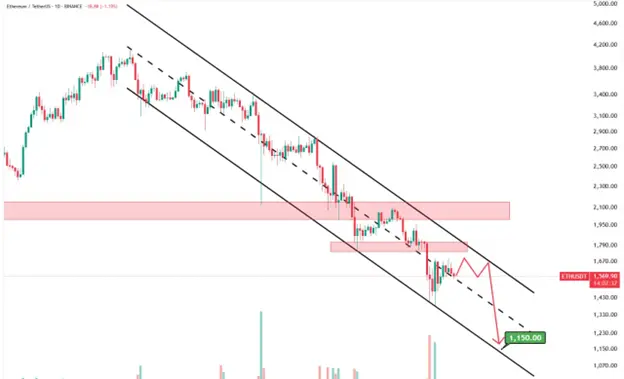
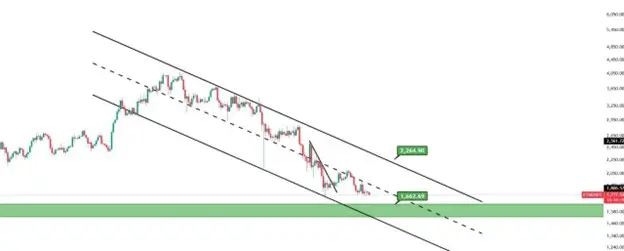
In the 4-hour timeframe, ETH is moving in a descending channel. We may see downward movement toward $1,600-$1,700.
Breaking the channel midline downward could lead to targets at $1,200 and then $1,000.
Risk management is crucial in current market conditions.
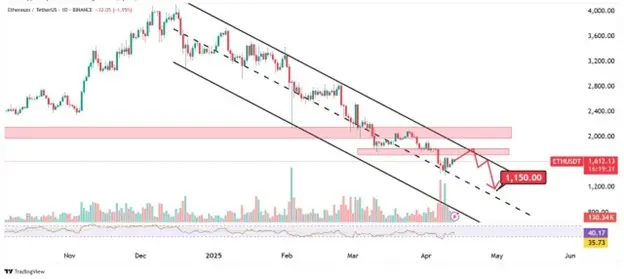
ETH continues its downward trajectory. A critical zone lies at $1,850-$2,000. If price retests this area and rejects, we could see further declines to $1,300 and $1,150.
*Long-term investors may consider accumulating ETH at lower prices with a 1+ year horizon.*
The daily chart shows strong bearish momentum. Initial targets are $1,660, with potential extensions to $1,200 and $1,050 if key supports break.
The $1,400-$1,550 zone may provide support and reaction points within the descending channel.
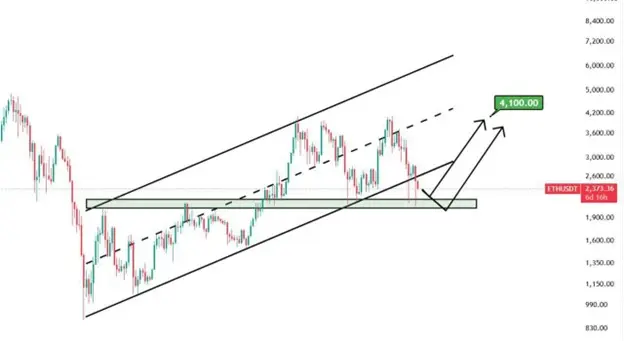
ETH’s weekly trend remains bullish despite recent corrections. The current pullback presents attractive entry opportunities for 6+ month investments.
Key static support sits at $1,900-$2,100. If bullish momentum resumes, primary targets are $4,100 and $4,300.
Strict risk management is essential for traders currently.
Ethereum Analysis: A Comprehensive Guide to Smart Investment
Ethereum analysis is considered one of the essential prerequisites for informed activity in the cryptocurrency market. This analysis helps investors make more precise trading decisions by better understanding market trends. The Homoro team, leveraging years of experience in financial markets and backed by the scientific support of Shahid Beheshti University, provides practical analyses and Ethereum-related signals so investors can trade with greater confidence.

About the Ethereum Cryptocurrency
Ethereum was introduced in 2015 by Vitalik Buterin, a Russian-Canadian researcher and programmer, as a decentralized platform based on smart contracts. Unlike Bitcoin, which is merely a digital currency, Ethereum is a complete ecosystem for running decentralized applications (DApps).
The native token of this network (Ether or ETH) acts as fuel for transactions and smart contracts. A crucial point to note is the absence of a fixed supply cap for Ethereum, though token-burning mechanisms in recent updates have helped control its inflation.
At Homoro, under the guidance of Dr. Sadra Ahmadi and with an experienced team, we provide cryptocurrency analyses through various methods. To get started, visit our Telegram channel (@Homo_inv) and benefit from free Ethereum signals.
Price History of the Ethereum Cryptocurrency
Ethereum’s price has experienced significant fluctuations since its initial launch in 2015. Historical data shows that the value of Ether has risen from a few dollars initially to several thousand dollars in recent years.
One of the key historical milestones was the network’s upgrade to the Proof-of-Stake (PoS) protocol in 2022, which directly impacted Ethereum’s price increase. Additionally, numerous factors such as technological advancements, adoption by major institutions (like Meta and Amazon), and regulatory changes in various countries have influenced its price trends.
At Homoro, we monitor these developments and, through accredited training courses under Shahid Beheshti University, help you succeed in this dynamic market.

Ethereum Price Prediction
Predicting Ethereum’s price is not straightforward, as many factors—such as global news, network updates, or market sentiment—affect it. However, with proper analysis, you can increase your chances of success in the Ethereum market. For example, when the number of new smart contracts on the Ethereum network increases, it is usually a sign of growing demand and a potential price rise.
Ethereum Analysis Methods
To succeed in the Ethereum cryptocurrency market, you must familiarize yourself with different analysis methods. Below, we explain the three main Ethereum analysis methods, each providing a better understanding of the Ethereum market.
۱. Technical Analysis
Technical analysis involves examining price charts and using tools such as the Relative Strength Index (RSI), moving averages, and Fibonacci retracements. Essentially, this method relies on statistical analysis of historical price data and trading volumes.
In simpler terms, technical analysis helps you identify price patterns and determine the optimal time to buy or sell Ethereum. For example, RSI values above 70 indicate overbought conditions and a potential price correction.
Similarly, when the price approaches a Fibonacci level, a trend reversal may occur. At first glance, these tools might seem complex, but with practice and Homoro’s training, you can easily master them.

۲. Fundamental Analysis
Fundamental analysis of Ethereum focuses on core factors such as network utility, industry adoption, and protocol upgrades. For instance, when Ethereum introduced new upgrades like sharding, its value increased because network efficiency improved. On the other hand, regulatory restrictions in certain countries can negatively impact its price.
At Homoro, we are well aware of these factors and explain them in simple terms so you can understand Ethereum’s true value and make smarter trading decisions.
۳. On-Chain Analysis
On-chain analysis examines Ethereum blockchain data, such as transaction counts, active addresses, smart contract volumes, and network fees (gas). For example, an increase in active addresses usually indicates new investors entering the market and potential price growth. Similarly, when gas fees (transaction costs) decrease, it reflects improved network efficiency, which can contribute to price appreciation.
On-chain analyses help you better understand real market behavior and leverage blockchain data for better decision-making.
Key Points in Ethereum Analysis
Ethereum analysis is not limited to tools and data; you need a solid strategy to capitalize on opportunities and avoid mistakes. Below are some key tips based on years of experience from the Homoro team.
۱. Choosing the Right Time Frame
Your trading time frame should align with your strategy. Short-term time frames (e.g., 1-hour) are suitable for day trading, but they come with higher volatility and risk. Conversely, long-term time frames (e.g., daily or weekly) are better for stable investments, as they better reflect major market trends.
۲. Identifying Key Support and Resistance Levels
Support and resistance levels are points where the price typically reacts. Support is where buyers enter the market, preventing further price declines, while resistance is where sellers push the price down. Recognizing these levels helps you find the best trading opportunities.
۳. Monitoring Trading Volume
Trading volume is another critical indicator in Ethereum analysis. A sudden surge in volume often signals a major price movement. For example, high buying volume can precede a price rally. Homoro’s analyses help you identify these signals in time.
Frequently Asked Questions
If you have any questions, you can contact our team of experts:
۱. What is Ethereum analysis?
Ethereum analysis is the systematic evaluation of market data (including price, volume, and technical indicators) and fundamental factors (such as network upgrades and regulations) to predict future price trends.
۲. How can I learn Ethereum analysis?
With Homoro’s training courses, accredited by Shahid Beheshti University, you can learn Ethereum analysis professionally. Our daily signals are also a great guide for beginners.
۳. What is the difference between on-chain and technical analysis?
On-chain analysis focuses on blockchain data (e.g., transactions and active addresses), while technical analysis examines price charts and market patterns.
Conclusion
Given the inherent complexity of the cryptocurrency market, Ethereum analysis requires a combination of quantitative (technical and on-chain) and qualitative (fundamental) methods. Each of these methods can help you maximize profits from Ethereum trading.
The Homoro team, in collaboration with Shahid Beheshti University, offers structured training courses and data-driven analyses. To benefit from these services, visit our Telegram channel (@homoro_sale).