
Daily Bitcoin Analysis
Bitcoin (BTC), a digital currency and a specific type of digital asset, holds the top position in the market rankings with a market cap of approximately $2.09 trillion. Currently, with a dominance of 62.37%, it plays a major role in this sector. Each unit of Bitcoin is trading at $105,316, which, at the Tether rate of 82,816 Tomans, equals 8,721,904,075 Tomans. Its daily trading volume also reaches $37.3 billion.
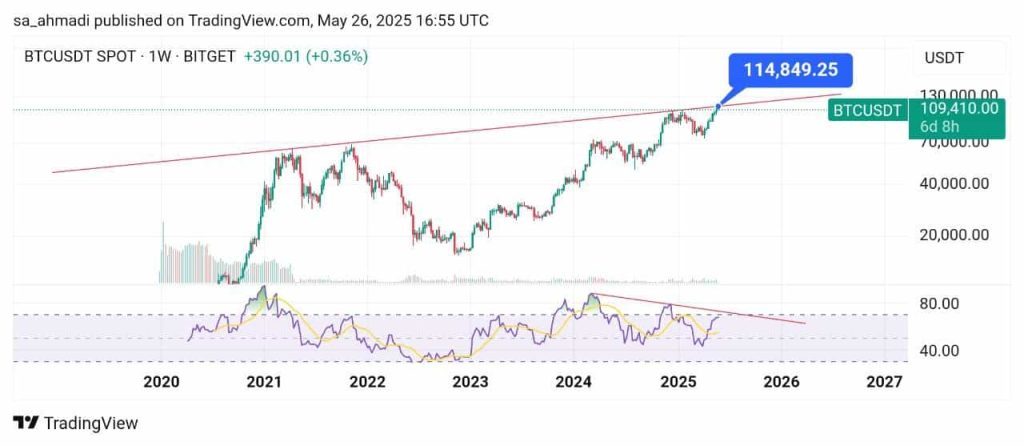
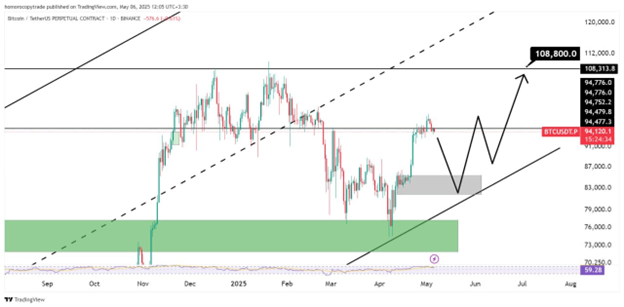
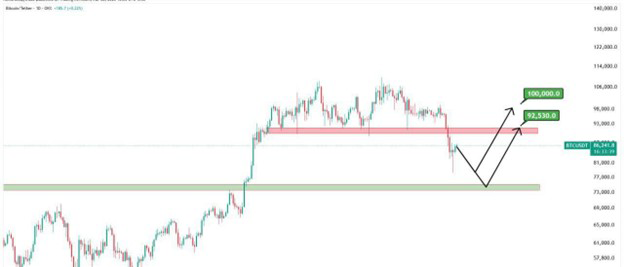
Bitcoin Analysis – 5 Khordad
Bitcoin, in the weekly timeframe as seen in the chart, is positioned below an ascending trendline. It has reacted to this trendline three times so far, resulting in price declines.
Given that this trendline has acted as a critical resistance zone in the past, Bitcoin may once again react to this zone and experience a price drop.
The target for the price correction from this trendline depends on Bitcoin’s behavior around the $90,000 level, which serves as a major support zone for this asset.
For Bitcoin, two scenarios can be considered:
First Scenario: Bitcoin manages to strongly break above the red trendline (around $114,000–$115,000) and continues its upward trajectory.
Second Scenario: If Bitcoin starts another correction from the red trendline, given the strong negative divergence in the RSI chart, the $114,000 level could be considered as Wave B of the correction, following Wave A (from $67,000 to $16,000). In this case, we could expect a Wave C correction.
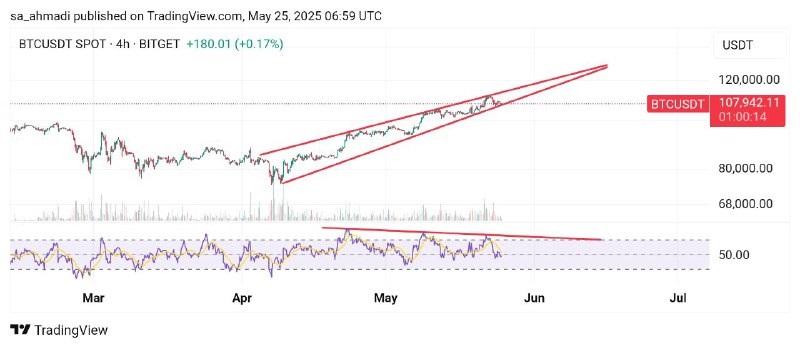
Bitcoin Analysis – 4 Khordad
Bitcoin is forming a significant compression between the two red trendlines drawn on the chart. Additionally, the RSI chart shows a strong negative divergence.
If Bitcoin breaks below the compression zone, its first valid support will be around $101,000. If this level is breached, Bitcoin’s uptrend will effectively be invalidated, and a downtrend or corrective phase will begin.
However, if Bitcoin manages to break above the compression zone with strong bullish candles, reaching the $120,000 target would not be far-fetched.
Note: The above content is solely the analysis of the Homoro team and should not be considered as buy/sell signals.
Bitcoin Analysis – 4 Khordad (BTC) – May 8
In the 4-hour timeframe, Bitcoin has shown strong upward momentum following the interest rate news and could potentially reach its previous high or even surpass it.
Note that this upward move has not yet seen a correction, and while a minor pullback is possible, the short-term momentum remains strongly bullish.
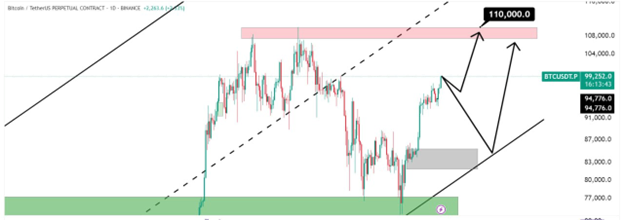
Urgent Bitcoin Analysis
Bitcoin has reached $100,000.
As seen, Bitcoin is moving in an ascending channel with strong bullish momentum, indicating no immediate signs of a correction. Bitcoin’s dominance, one of the most important indicators of its market influence, suggests that major capital in the crypto market is still flowing into Bitcoin. Therefore, we can expect Bitcoin to move directly toward its all-time high, first targeting $108,000.
If this high is broken upward, we could even see targets of $115,000 and then $127,000. However, Bitcoin’s movement near the peak is crucial, and we may see corrections toward the $90,000 zone.
Bitcoin (BTC) Analysis – May 6
In the 4-hour timeframe, Bitcoin is moving in an ascending channel and appears poised for further growth. A correction to $83,000–$85,000 is possible, but after the correction, entering at key levels is essential.
If the bullish trend continues, the initial target is $108,000, followed by $120,000. However, Bitcoin’s movement near the peak is critical, and corrections toward $90,000 are possible.
Risk management is extremely important in these market conditions.
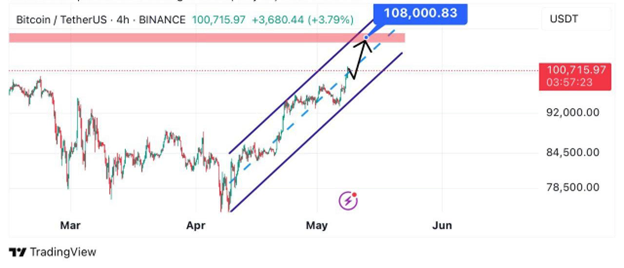
Bitcoin (BTC) Analysis – May 3
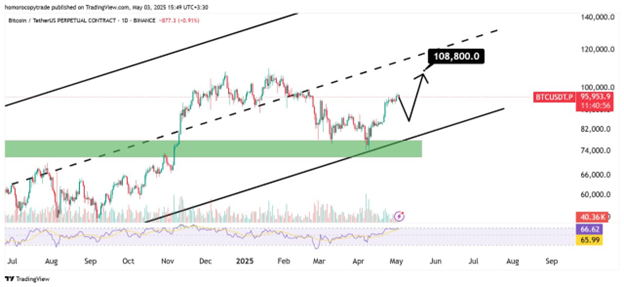
In the 4-hour timeframe, Bitcoin is moving in an ascending channel. After a short-term correction, we may see a retest of the high, and if it holds, the first target would be $108,000.
Bitcoin’s upward wave is very strong, and we may easily reach the peak, but corrections along the way are likely. The short-term correction target could be the $81,000–$83,000 zone.
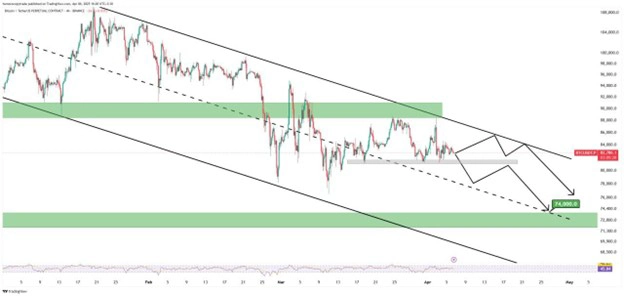
Bitcoin (BTC) Analysis – April 23 (Weekly Timeframe)
Bitcoin has reacted to a critical level in the weekly timeframe. If it can break and confirm the downtrend line upward, a growth phase may begin.
If Bitcoin moves and consolidates above the $74,000–$76,000 zone, it could target $86,000 and then $90,000. However, failure to hold this level could lead to a correction toward $65,000.
Candlestick patterns in the coming weeks will be crucial. If the upcoming interest rate news shows a decrease, we can expect market growth.
Risk management is decisive in these market conditions, so closely monitor Bitcoin’s movement as the leading market indicator.
Bitcoin (BTC) Analysis – April 17
Bitcoin is in a downtrend, and the political and economic events triggered by Trump have caused declines in international markets and commodities. New tariffs have introduced a recessionary wave in global markets, which could also impact the cryptocurrency market.
Bitcoin has been ranging around the $80,000–$82,000 support zone. If this level breaks, the next targets could be $74,000 and then $72,000.
Risk management is critical in these conditions. Futures trading may yield better results than spot trading at this time.
Bitcoin (BTC) Analysis – March 18

After extreme volatility in the past week and the largest historical gap caused by Trump, Bitcoin is currently ranging between $80,000 and $96,000.
In the coming days, Bitcoin may initiate an upward move from $82,000 or $78,000, targeting $92,000 initially and, if broken, $98,000.
Bitcoin (BTC) Analysis – March 12
After breaking below its previous low, Bitcoin experienced intense bearish momentum, even dipping below $80,000. It may see even lower levels.
The market is being affected by Trump’s tariff wars and the Russia-Ukraine conflict. Until these issues are resolved, the market remains uncertain, and capital outflows are still evident.
General Structure of Bitcoin Analysis
Bitcoin analysis helps us make the best decisions for buying or selling this cryptocurrency at specific times by examining market data and trends. Essentially, analyzing Bitcoin means reading the market’s pulse through data and charts to identify the optimal times to buy or sell. At Homoro, with years of experience, we simplify Bitcoin analysis for you. Our daily signals and transparent analyses help you trade cryptocurrencies—especially Bitcoin—with greater confidence.

About Bitcoin
Bitcoin emerged in 2009 from a groundbreaking idea. Satoshi Nakamoto, whose identity remains unknown, created a currency that no bank controls. Transactions for this digital currency are recorded on blockchain technology, like a public ledger that everyone can see but no one can manipulate. Additionally, there will only ever be 21 million Bitcoins in existence.
To succeed in the Bitcoin market, precise and professional analysis is crucial. The Homoro team, led by Dr. Sadra Ahmadi and backed by years of experience in financial markets, provides you with daily signals and global news to achieve the best results.
Bitcoin Price History
From its inception (2010) to 2025, Bitcoin’s price history has seen extreme volatility. In 2010, a few Bitcoins could only buy you a pizza because its value was just a few cents. But now, in 2025, each Bitcoin is worth over $100,000.
Factors such as new government regulations or statements from influential economic figures like Elon Musk can impact Bitcoin’s price fluctuations. For example, when China restricted Bitcoin mining in 2021, the price surged dramatically.
At Homoro, we monitor these developments closely. Our team, with years of financial market expertise, helps you anticipate these fluctuations. Additionally, our certified educational courses (accredited by Shahid Beheshti University) in financial markets and cryptocurrencies make your path to trading success smoother.
Bitcoin Price Prediction
Predicting Bitcoin’s future value is challenging due to the many factors influencing it. Global news, central bank decisions, or even rumors can alter Bitcoin’s price. However, with the right data, you can increase your chances of profiting. For instance, when buyer demand rises, the price is often poised for a surge.
Technical Analysis of Bitcoin
Technical analysis involves studying price charts to determine the best times to buy or sell. Tools like moving averages, Relative Strength Index (RSI), and Bollinger Bands indicate market direction. For example, when the RSI shows overbought conditions, a price drop may follow.
Moving averages help identify market trends, while Bollinger Bands measure price volatility. While these tools may seem complex at first, practice makes mastering them easier.

Fundamental Analysis of Bitcoin
Fundamental analysis explains why Bitcoin holds value and which factors influence it. This approach examines global Bitcoin adoption, regulatory changes, and blockchain advancements.
For instance, when El Salvador adopted Bitcoin as legal tender in 2021, its price spiked. Conversely, when China imposed restrictions the same year, the market turned bearish. Other factors, such as corporate adoption or blockchain protocol upgrades, also impact Bitcoin’s value.
At Homoro, we simplify these factors by aggregating global news and market insights. Our fundamental analyses help you understand Bitcoin’s true value and make better trading decisions.
On-Chain Analysis
On-chain analysis examines blockchain data, such as transaction counts, trading volumes, active wallets, and hash rates. These metrics reveal market behavior. For example, a rise in new wallets often signals increased demand and potential price growth. A high hash rate indicates network security and miner confidence in Bitcoin.
Key Points in Bitcoin Analysis
Analyzing Bitcoin isn’t just about charts. You must know which steps lead to profits and which mistakes to avoid. Below are critical Bitcoin analysis tips:
Trading Bitcoin Across Timeframes
Choosing the right timeframe is crucial. Short timeframes (e.g., 1-hour) suit quick trades but carry high risk, as prices can shift rapidly. Longer timeframes (daily/weekly) are better for major investments, as price trends are more stable.

Support and Resistance Levels
Identifying support (where buyers prevent further drops) and resistance (where sellers cap upward movement) is vital for timing trades.Understanding Bitcoin Charts
Bitcoin charts reveal critical market insights:Candlesticks show price movements within a timeframe.
Trendlines indicate market direction.
High trading volumes often precede major price shifts.
Mastering these charts requires practice.
Frequently Asked Questions
For any questions, contact our experts:
What is Bitcoin analysis?
It’s the study of market data and trends to predict price movements and make informed trading decisions.How can I learn Bitcoin analysis?
Homoro’s certified courses (accredited by Shahid Beheshti University) teach analysis. Our daily signals also serve as a practical guide.What’s the difference between on-chain and technical analysis?
On-chain analysis reviews blockchain data, while technical analysis focuses on price charts.
Conclusion
Bitcoin is a world of opportunity, capable of delivering significant profits—but without proper analysis, losses are likely. From charts and blockchain data to global news, each piece of information can bring you closer to success.
At Homoro, with years of experience in crypto and financial markets, we provide the best Bitcoin analyses, transparent signals, and certified courses. Ready to begin? Join our Telegram channel (@homoro_sale) and take your first steps today!